DaisyOS
Products
Solutions
Support
Language / 语言
Get a Free Quote
VOTE · WHITEBOARD · CHART

Uvote — Create Polls
Let Data Speak

Create a poll → embed in a whiteboard → data becomes charts.

Create single-choice or multiple-choice polls, view results instantly. Need discussion? Embed the poll into a whiteboard for your team to annotate and discuss. Results are automatically visualized into charts for clearer data.

Create Poll Whiteboard Embed Data Charts Live Results Team Collaboration

Vote, Discuss, See Data — All in One Flow

See how Uvote connects poll creation, whiteboard discussion, and data charts into a smooth decision-making flow.

Uvote — Team Voting & Data Insights
Create Polls · Embed in Whiteboards · Auto Charts · Live Results
⏱ Product Demo · 1 min

▶ Learn About Uvote

Quick poll creation — single-choice, multiple-choice, anonymous

Whiteboard embedding — polls in the canvas for team annotation and discussion

Auto charting — results become bar charts, pie charts, and more

Let Data Help You Decide

Create polls → whiteboard discussion → data charts.

Quick poll creation
Create Poll

Quick to Create, Flexible to Configure

Supports single-choice, multiple-choice, and anonymous polls. Share the link and results update in real time.

  • Multiple modes — single/multiple/anonymous
  • One-click share — link or QR code
  • Real-time results — available instantly
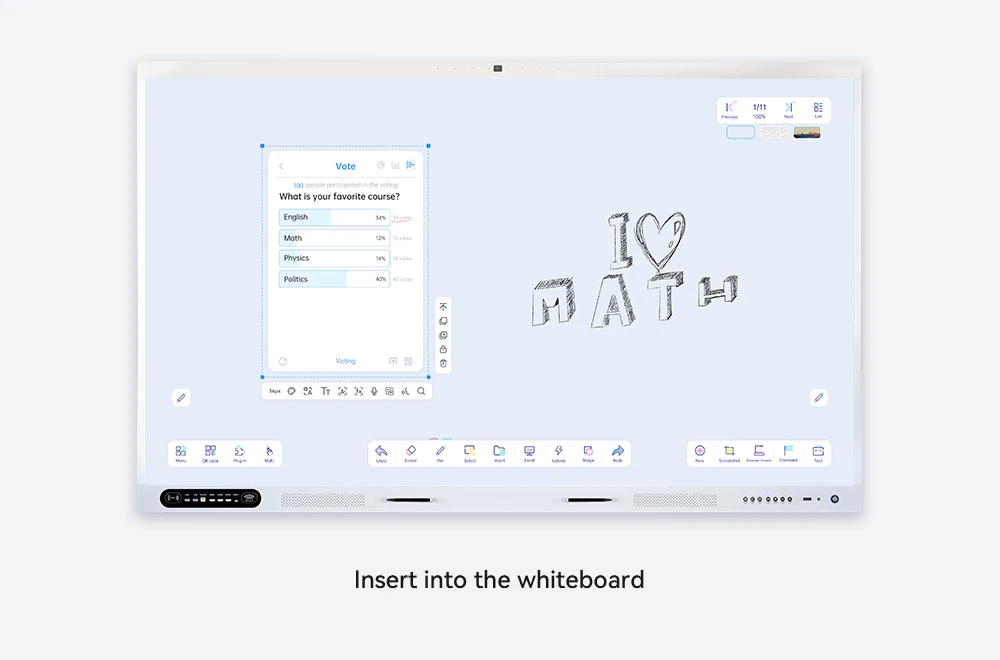
Embed polls into whiteboard
Whiteboard Embedding

Embed Polls into Whiteboards for Discussion

Click "Embed in Whiteboard" and the poll appears on the canvas. Team members can annotate and add comments.

  • One-click embed — polls onto the whiteboard
  • Multi-user annotations — highlight and comment
  • Discussion tied to polls — opinions alongside data
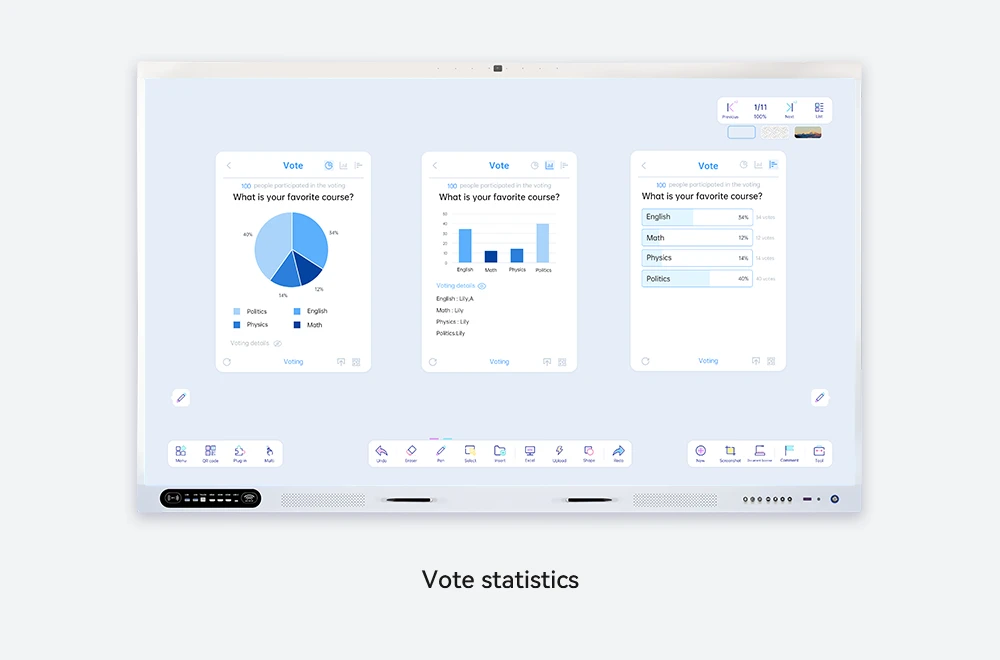
Automatic chart generation
Data Charts

Automatic Chart Generation

After voting, data is visualized into bar charts, pie charts, and more. Charts can be exported or embedded in reports.

  • Auto charts — bar/pie
  • Interactive viewing — hover for details
  • Export & share — image or PDF

For Common Decision-Making Scenarios

From team meetings to user research, Uvote backs decisions with data.

Team Meetings

Run an anonymous poll to gather team opinions. Embed it in a whiteboard for discussion, results become charts for reference.

Plan Evaluation

Create a poll to compare multiple proposals, results shown as comparison charts. Discuss and analyze on the whiteboard.

User Research

Run a survey poll, data is compiled into charts. Export and embed into proposal documents for reporting.

Common Questions

Quick answers about Uvote's voting features.

Yes. Polls stay synced after embedding. The whiteboard shows the latest results and chart updates.
Yes. You can enable anonymous mode when creating a poll; voter identities are hidden from others.
The free tier supports a certain number of participants per poll. Choose a plan that fits your needs.
📩 Request a Quote

Need a Solution That
Fits Your Project?

Tell us what you're looking for and we'll tailor a quote to your requirements — with pricing, lead time, and expert advice.

HeadquartersRoom 201, No. 5, Chang An Zhenyuan East Road,
Dongguan, Guangdong, China
Get Your Custom Quote
Fill out the form and we'll get back to you within 12 hours.
Quick InquiryGet a quote
✓ Sent! We'll reply within 4 hours.
Chat on WhatsAppReply in minutes